File:GraphicalReports-TimelineChart-example-landscape-50.png
Size of this preview: 800 × 538 pixels. Other resolutions: 320 × 215 pixels | 1,146 × 771 pixels.
Original file (1,146 × 771 pixels, file size: 70 KB, MIME type: image/png)
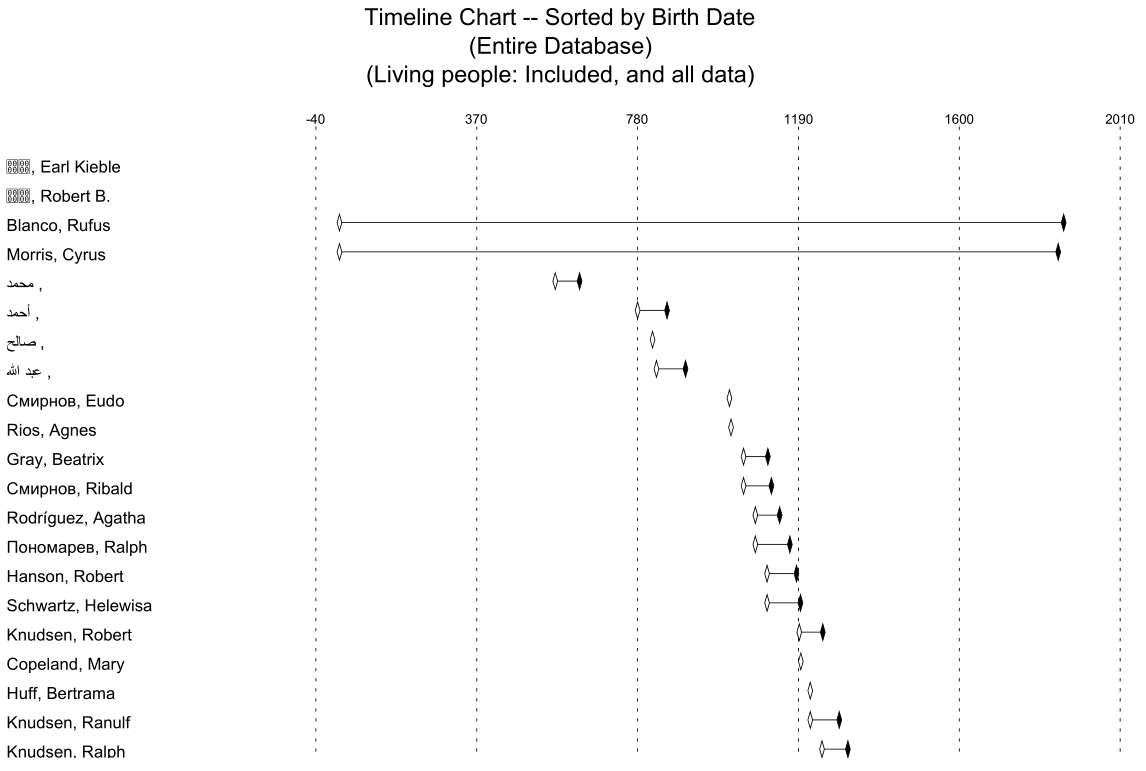
Timeline Chart - Graphical Reports - example output overview (Gramps 5.0.0; Microsoft Windows 10; data from example.gramps)
File history
Click on a date/time to view the file as it appeared at that time.
| Date/Time | Thumbnail | Dimensions | User | Comment | |
|---|---|---|---|---|---|
| current | 21:08, 8 January 2018 | | 1,146 × 771 (70 KB) | Sam888 (talk | contribs) | Timeline Chart - Graphical Reports - example output overview (Gramps 5.0.0; Microsoft Windows 10; data from example.gramps) |
- You cannot overwrite this file.
File usage
The following 10 pages link to this file:
- Fi:Gramps 5.0 Wiki-käyttöohje - Raportit Osa 4
- Fi:Gramps 5.1 Wiki-käyttöohje - Raportit Osa 4
- Fi:Gramps 5.2 Wiki-käyttöohje - Raportit Osa 4
- Gramps 5.0 Wiki Manual - Reports - part 4
- Gramps 5.1 Wiki Manual - Reports - part 4
- Gramps 5.1 Wiki Manual - Reports - part 4/he
- Gramps 5.1 Wiki Manual - Reports - part 4/sk
- Gramps 5.2 Wiki Manual - Reports - part 4
- Gramps 5.2 Wiki Manual - Reports - part 4/he
- Gramps 5.2 Wiki Manual - Reports - part 4/sk